
The Surprising Trend in the Number of Homes Coming onto the Market
If you’re contemplating a move, staying informed about the current state of the housing market is crucial. Here’s an overview of the current inventory of homes available for sale. Whether you are in the process of buying or selling, the quantity of homes in your locality is a key factor to monitor.
The housing market exhibits recurring patterns known as seasonality, with distinct trends throughout the year. Spring marks the peak of homebuying activity and is typically when the highest number of homes are listed for sale (referred to as new listings in the industry). Conversely, in the latter part of the year, the volume of new listings tends to decline as the pace of sales decelerates.
The graph below utilizes data sourced from Realtor.com, offering a visual representation of this seasonality. It illustrates how the current year’s trends (depicted by the black line) deviate from the established norms (refer to the graph below):
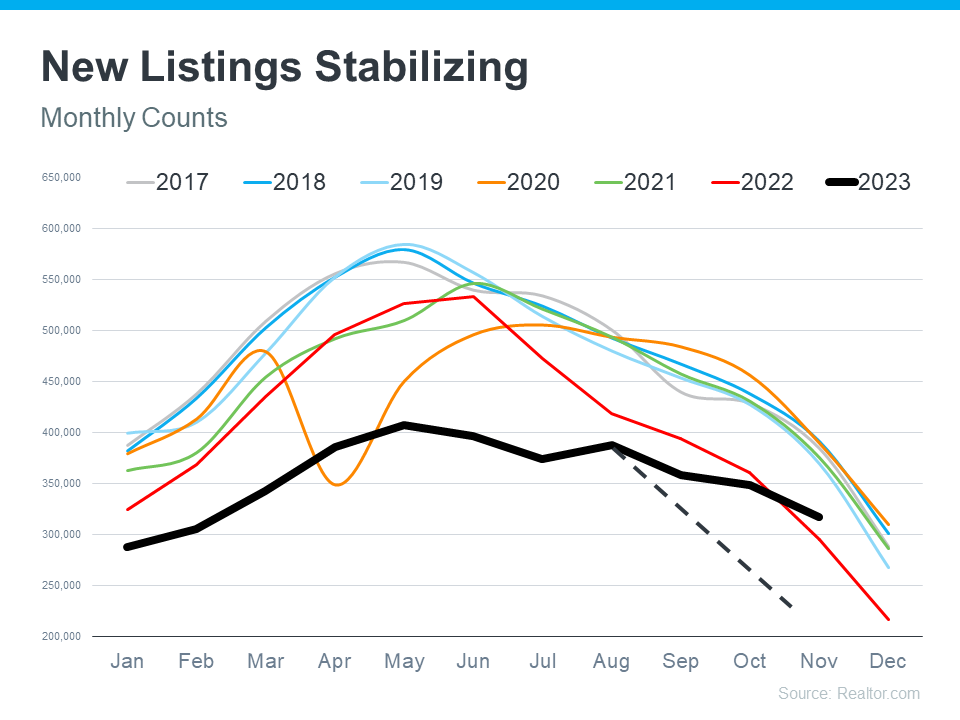
Looking at this graph, three things become clear:
The years 2017-2019, depicted by the blue and gray lines, adhere to a typical housing market pattern. The graph illustrates these years as representative of standard, seasonal trends.
However, starting in 2020, a deviation from the usual trend becomes apparent in the data. The notable decline in 2020, indicated by the orange line, corresponds to the onset of the pandemic, leading many sellers to temporarily halt their plans to relocate. In 2021 (the green line) and 2022 (the red line), the data follows a more traditional trajectory, yet both years exhibit abnormalities in their own right.
The current year, represented by the black line, stands out as truly unique. Contrary to the usual sharp decline in new listings at this time of the year, such a drop-off has not occurred. If 2023 were to conform to the norm, the line representing this year would resemble the dotted black line. Instead, the data reveals a stabilization in the number of new listings, with even more entries coming onto the market this year compared to the corresponding period last year.
What Does This Mean for You?
- For buyers, new listings stabilizing is a positive sign. It means you have a more steady stream of options coming onto the market and more choices for your next home than you would have at the same time last year. This opens up possibilities and allows you to explore a variety of homes that suit your needs.
- For sellers, while new listings are breaking seasonal norms, inventory is still well below where it was before the pandemic. If you look again at the graph, you’ll see the black line for this year is still lower than normal, meaning inventory isn’t going up dramatically and prices aren’t heading for a crash. And with less competition from other sellers than you’d see in a more typical year, your house has a better chance to be in the spotlight and attract eager buyers.
Bottom Line
Whether you’re on the hunt for your next home or thinking of selling, now might just be the perfect time to make your move. If you have questions or concerns about the availability of homes in our local area, let’s connect.


